
Quick Links
In fact, we’re probably a part of the electronic device you’re using right now. Our lithography technology is fundamental to mass producing semiconductor chips. With it, the world’s top chipmakers are creating microchips that are more powerful, faster and energy efficient.
2023 Annual Report
Discover our 2023 Annual Report, which highlights our financial performance, technological achievements and ESG commitments in the past year.

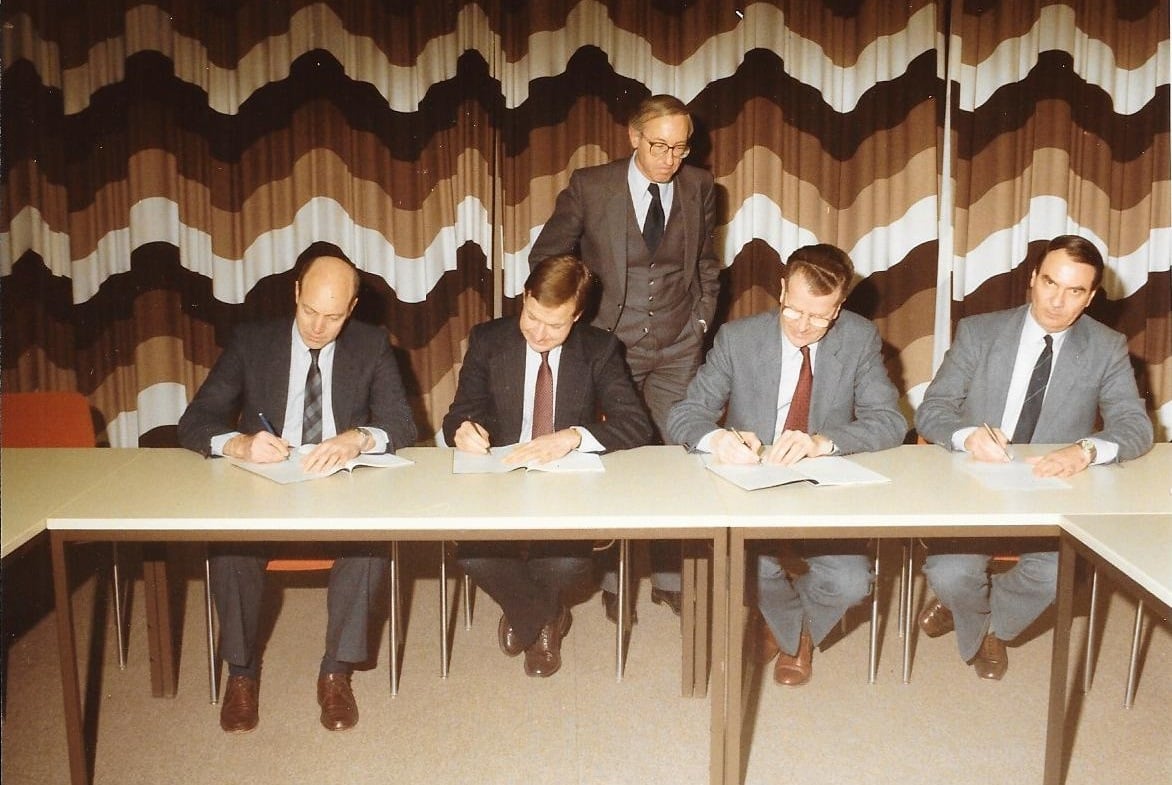
Forty years on, we look back at the industry trends and players that set the young company on a path of growth and innovation

In this interactive section you will hear from our employees. You’ll also discover how we foster your well-being and what our networks and clubs are like. We’ll show you how you’ll be supported to develop and upskill, and what your compensation and benefits package could include.
FRAUD ALERT: Scammers are targeting suppliers and ASML business partners with phishing emails from fraudulent domains. Read more here.
Work at asml


